Data Profiling
Part of being productive with data is having the right weapons to profile the data you are working with. Airflow provides a simple query interface to write SQL and get results quickly, and a charting application letting you visualize data.
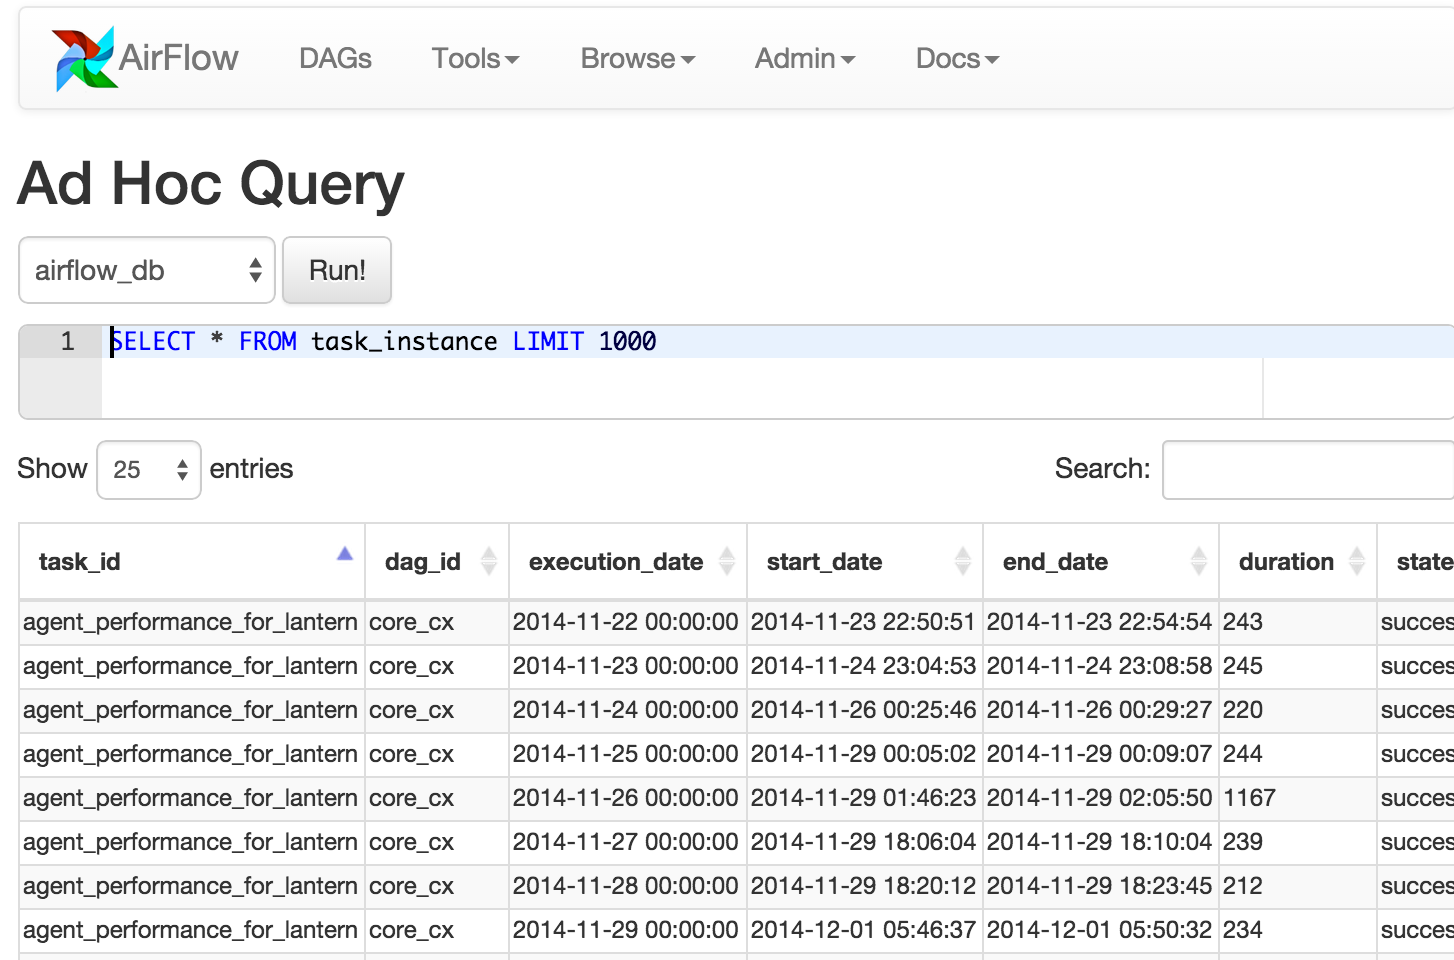
Adhoc Queries
The adhoc query UI allows for simple SQL interactions with the database connections registered in Airflow.
Charts
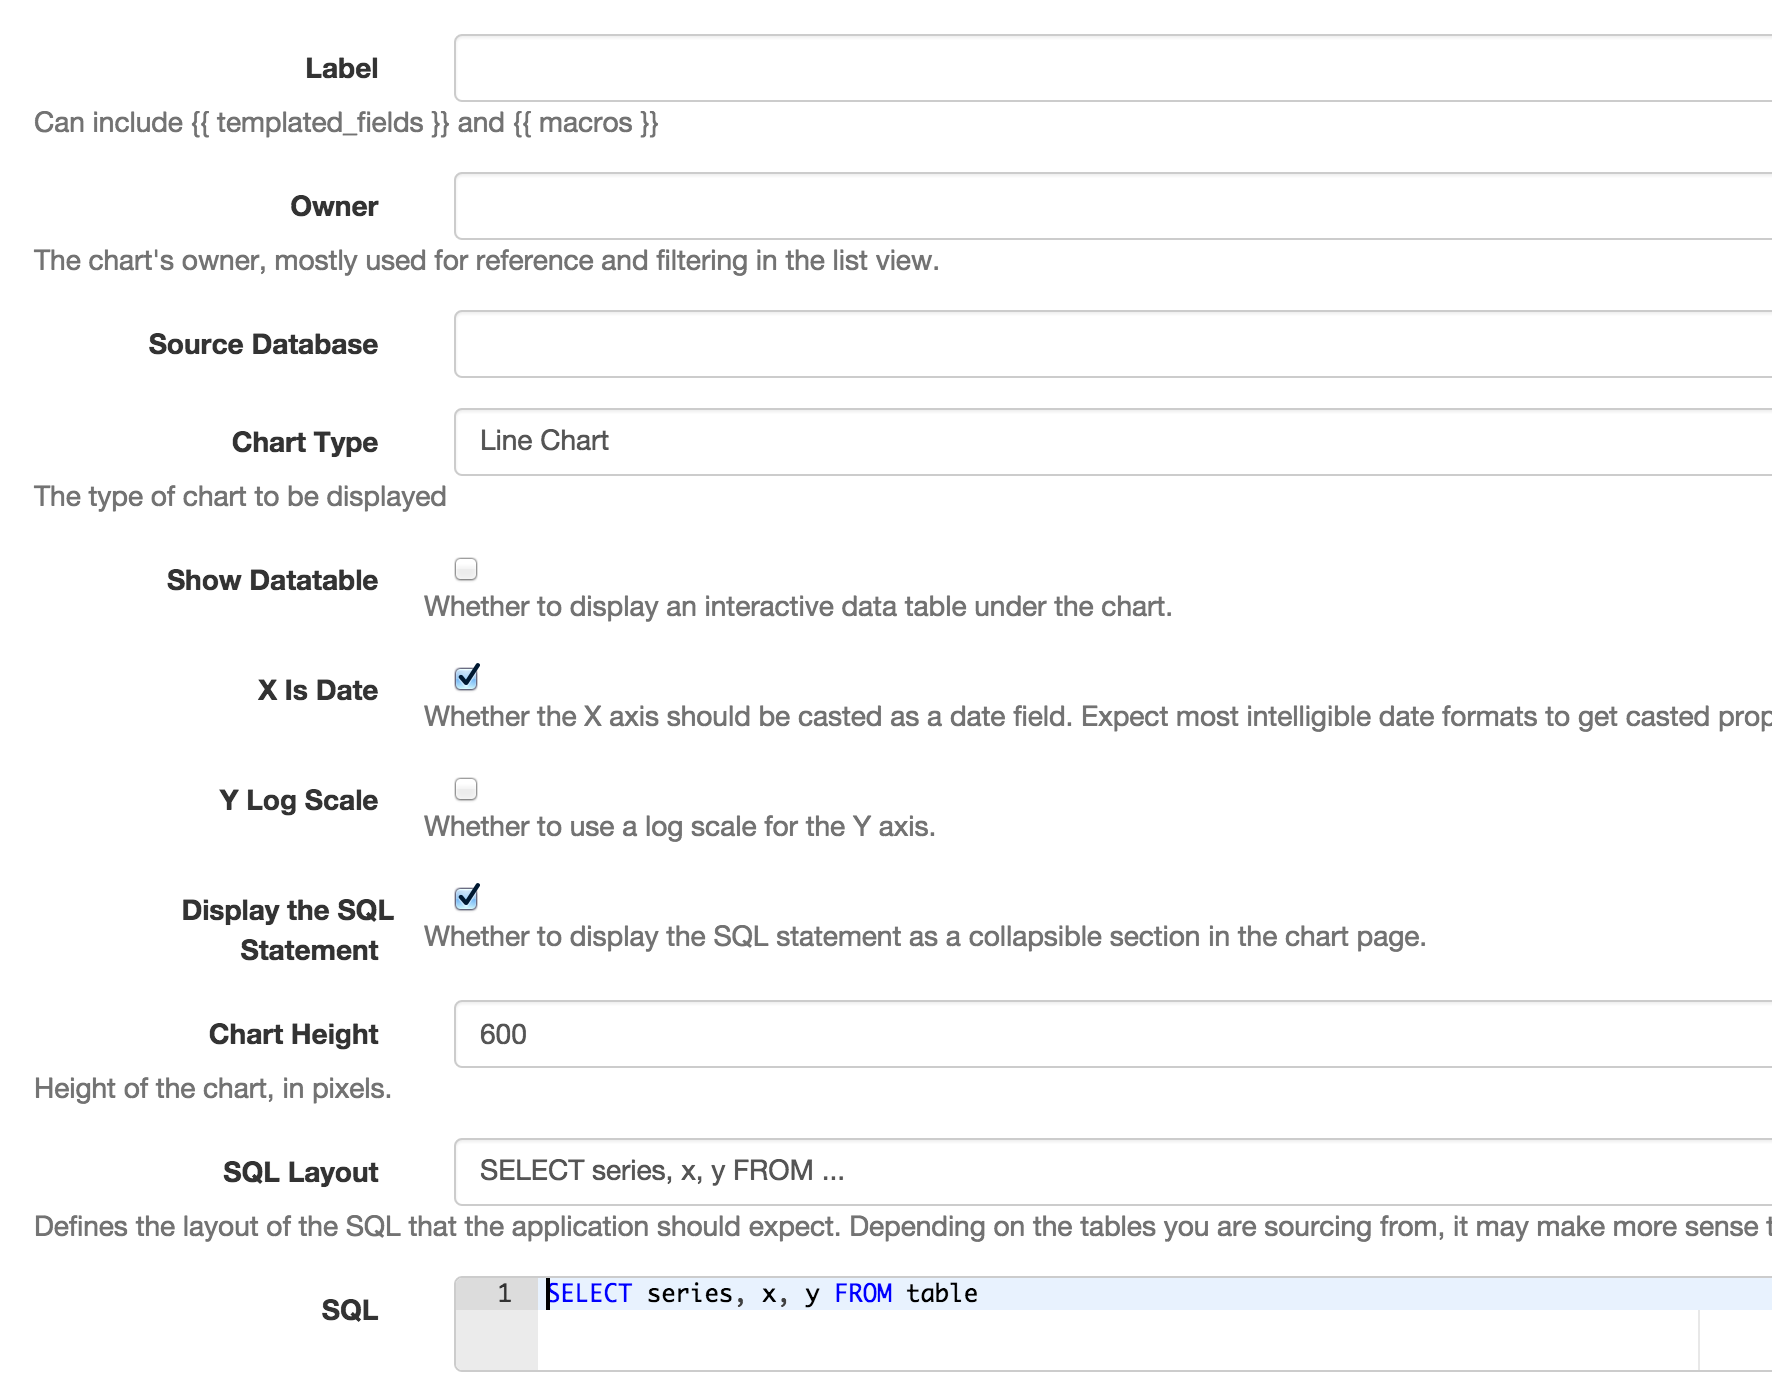
A simple UI built on top of flask-admin and highcharts allows building data visualizations and charts easily. Fill in a form with a label, SQL, chart type, pick a source database from your environment’s connections, select a few other options, and save it for later use.
You can even use the same templating and macros available when writing airflow pipelines, parameterizing your queries and modifying parameters directly in the URL.
These charts are basic, but they’re easy to create, modify and share.
Chart Screenshot
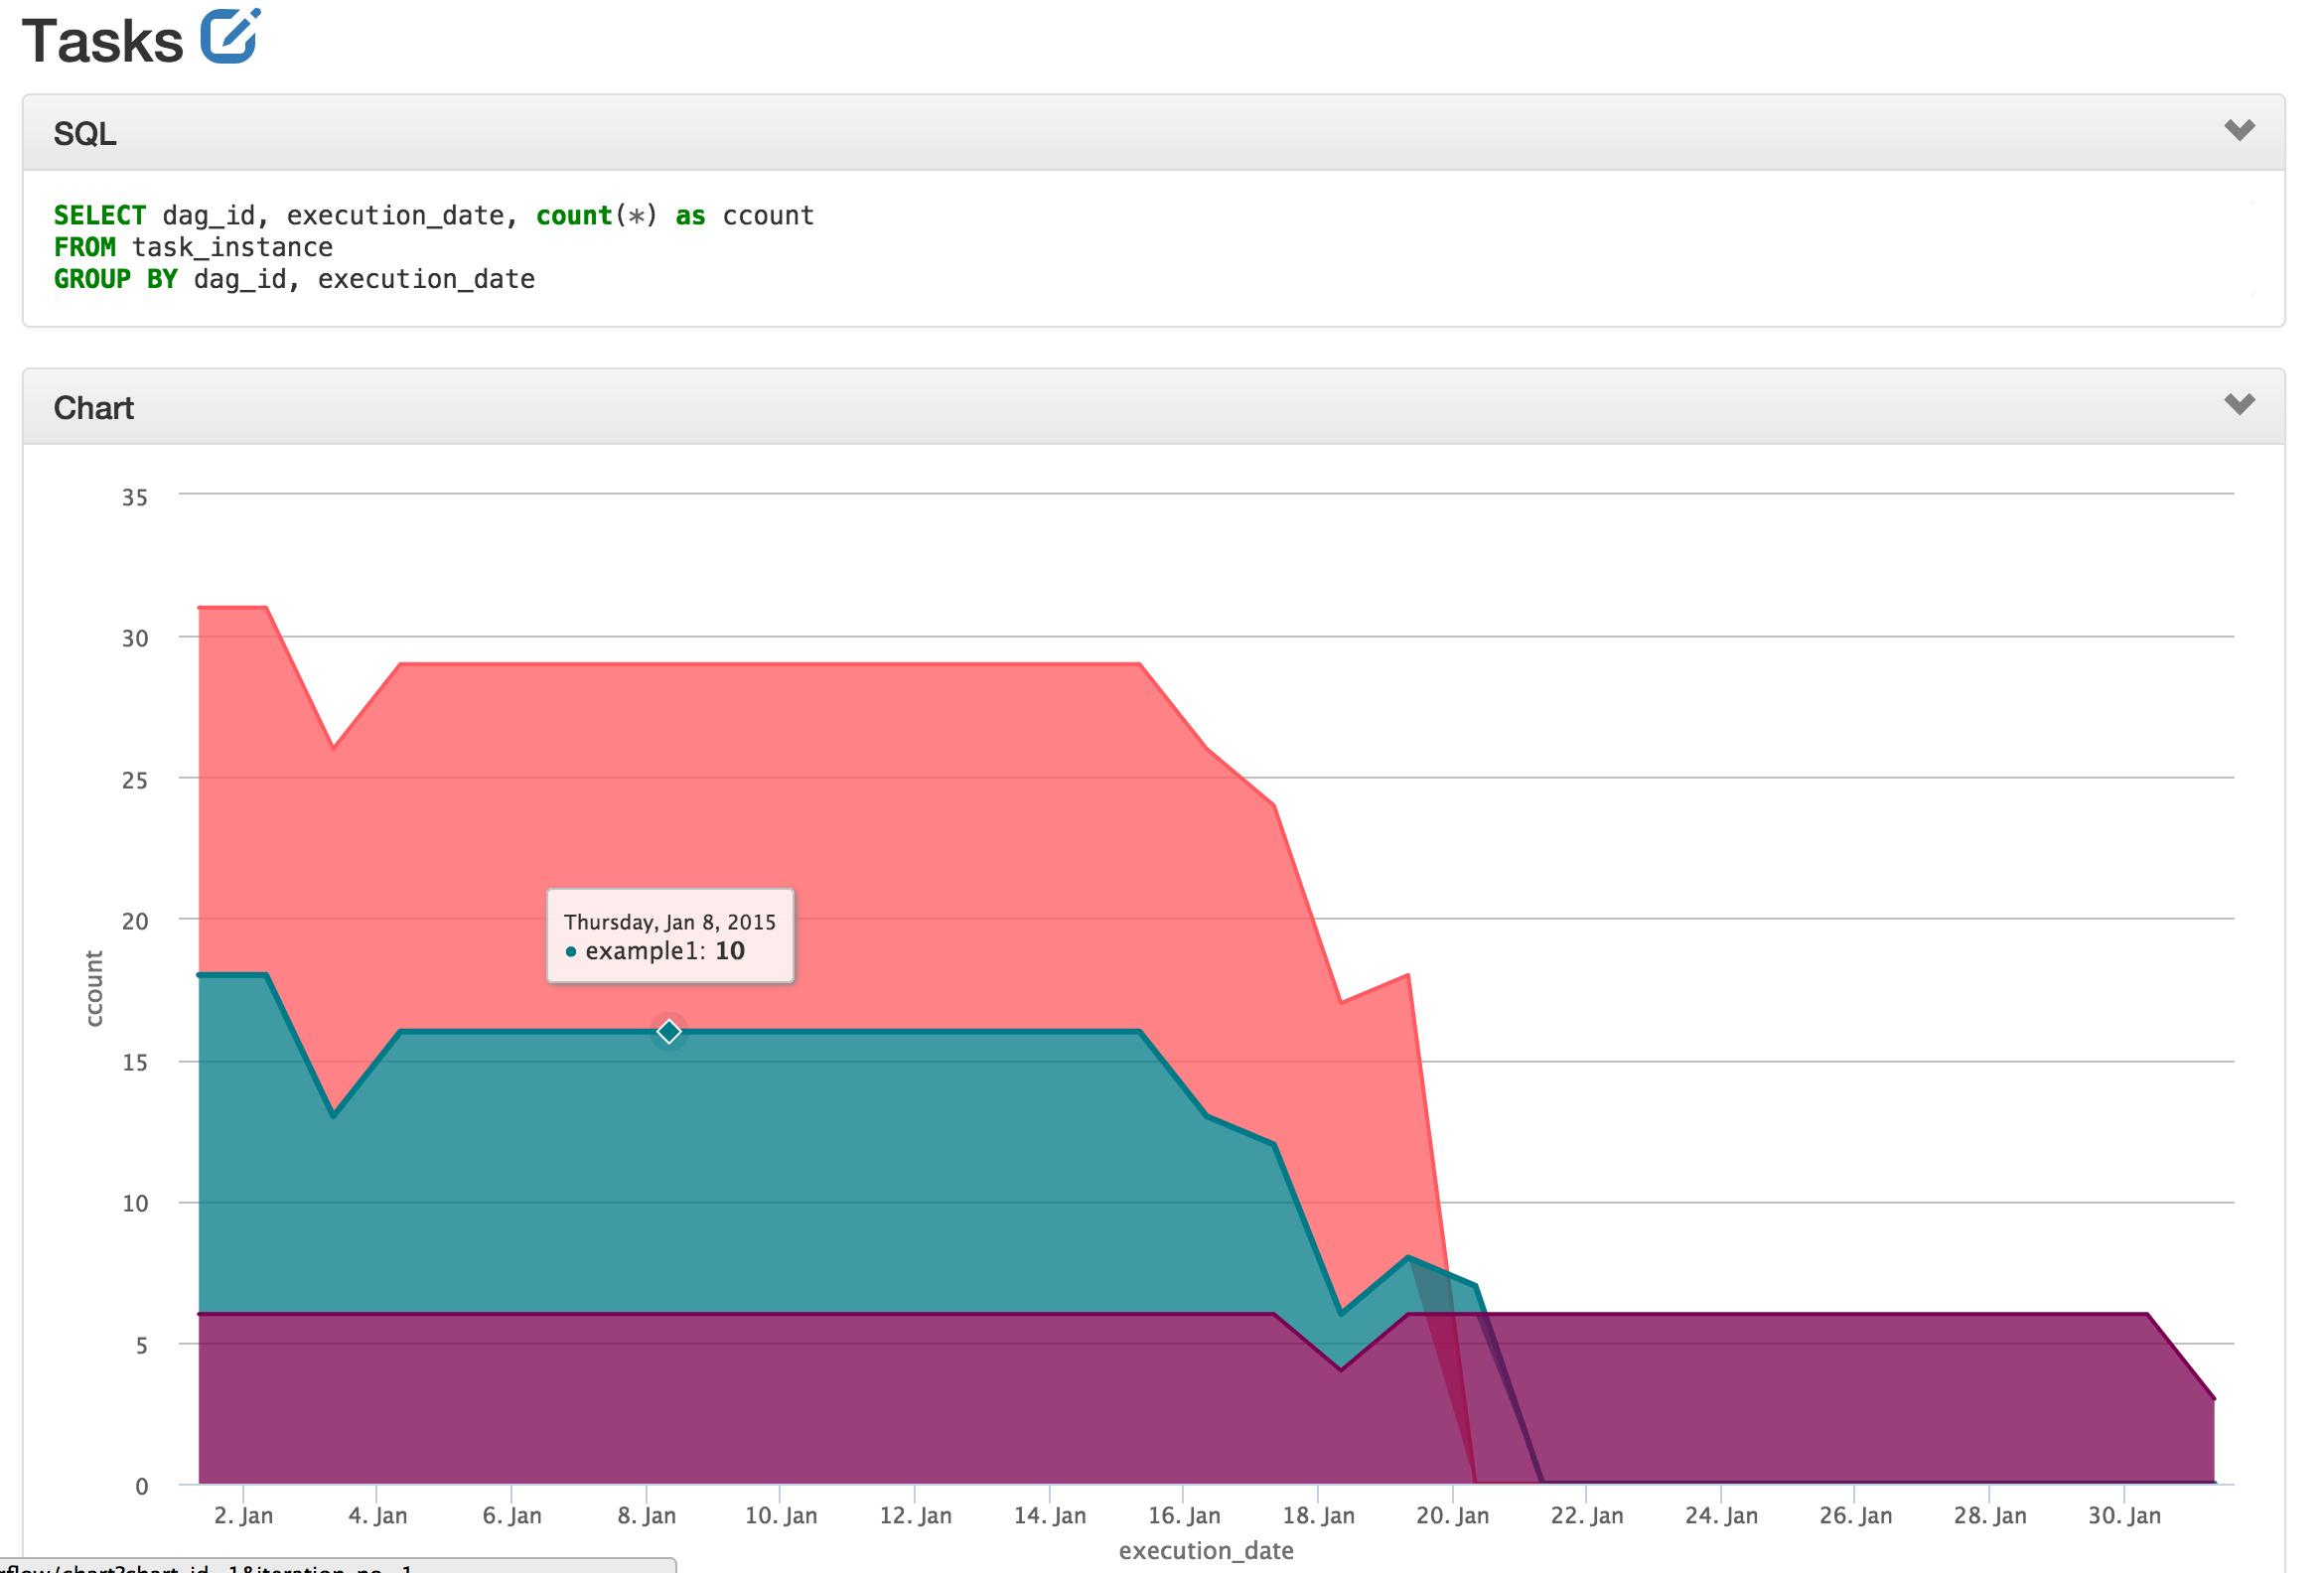
Chart Form Screenshot